Forecasting earthquake aftershock locations with AI-assisted science
From hurricanes and floods to volcanoes and earthquakes, the Earth is continuously evolving in fits and spurts of dramatic activity. Earthquakes and subsequent tsunamis alone have caused massive destruction in the last decade—even over the course of writing this post, there were earthquakes in New Caledonia, Southern California, Iran, and Fiji, just to name a few.
Earthquakes typically occur in sequences: an initial "mainshock" (the event that usually gets the headlines) is often followed by a set of "aftershocks." Although these aftershocks are usually smaller than the main shock, in some cases, they may significantly hamper recovery efforts. Although the timing and size of aftershocks has been understood and explained by established empirical laws, forecasting the locations of these events has proven more challenging.
We teamed up with machine learning experts at Google to see if we could apply deep learning to explain where aftershocks might occur, and today we’re publishing a paper on our findings. But first, a bit more about how we got here: we started with a database of information on more than 118 major earthquakes from around the world.
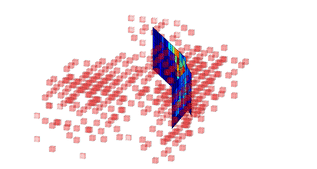
A visual representation of the 1992 magnitude 7.3 southern California Landers earthquake where the multi-colored portion represents the initial quake and the red boxes represent aftershock locations.
From there, we applied a neural net to analyze the relationships between static stress changes caused by the mainshocks and aftershock locations. The algorithm was able to identify useful patterns.
The end result was an improved model to forecast aftershock locations and while this system is still imprecise, it’s a motivating step forward. Machine learning-based forecasts may one day help deploy emergency services and inform evacuation plans for areas at risk of an aftershock.
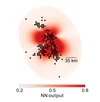
Forecasted distribution of aftershock location probabilities for the Landers earthquake. Dark red colors indicate regions predicted to experience aftershocks. The black dots are the locations of observed aftershocks, and the yellow line shows the faults that ruptured during the mainshock.
There was also an unintended consequence of the research: it helped us to identify physical quantities that may be important in earthquake generation. When we applied neural networks to the data set, we were able to look under the hood at the specific combinations of factors that it found important and useful for that forecast, rather than just taking the forecasted results at face value. This opens up new possibilities for finding potential physical theories that may allow us to better understand natural phenomena.
We are looking forward to seeing what machine learning can do in the future to unravel the mysteries behind earthquakes, in an effort to mitigate their harmful effects.