Street by street: How we’re mapping air quality in Europe

Since 2015, dozens of Street View cars outfitted with pollution sensors have been cruising the roads to track air quality in cities all over the world — from Oakland to Sydney. Over the past six years, these cars have collected more than 100 million street-by-street air quality measurements, all for Project Air View — our effort to bring detailed air quality maps to scientists, policymakers and everyday people. These hyperlocal air quality measurements are helping governments and communities make more informed choices about changes that can help city residents breathe cleaner air.
In celebration of EU Green Week next week, we are sharing a new air quality map for Copenhagen and recently started working with the City of Dublin to collect air quality measurements with Aclima technology in our first-ever, all-electric Street View car. This is all part of Google’s Environmental Insights Explorer (EIE), our free tool that provides thousands of cities with actionable data and insights to reduce their emissions.
Capturing air quality in Copenhagen
In 2018, we started mapping hyperlocal air quality in Copenhagen, working closely with the City of Copenhagen and Utrecht University, in collaboration with Aarhus University. The map — which is already being put to use — includes measurements of nitrogen dioxide (NO2), black carbon, and ultrafine particles. Through mapping street-by-street air quality we found that Copenhagen’s major access roads have nearly three times more ultrafine particles and nitrogen dioxide (NO2) and five times higher black carbon levels when compared to less trafficked residential areas.This air quality map shows the street-by-street average of nitrogen dioxide (NO2). Utrecht University & Google, 2021.
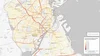
Armed with these air quality insights, the City of Copenhagen and urban planners are working to design future neighborhoods that include “Thrive Zones.” These zones aim to build places, like schools and playgrounds, away from high-pollution zones to provide young children with access to cleaner air. The city also plans to use the air quality data to encourage more sustainable transportation and create healthier bicycle and walking routes away from car traffic.
An all-electric Street View car hits the road in Dublin
We’ve also partnered with the City of Dublin to gather hyperlocal air quality measurements in Ireland’s capital, where our first all-electric Street View vehicle, a Jaguar I-PACE, has hit the roads. This is the first time an all-electric Google Street View car is being used to capture air pollution and greenhouse gas measurements and Google Street View imagery — a feat made possible due to Jaguar Land Rover engineers integrating Google's Street View technology and specialized Aclima sensors into the vehicle.Our Jaguar I-PACE is able to measure nitrogen dioxide (NO2), nitric oxide (NO), carbon dioxide (CO2), carbon monoxide (CO), fine particulate matter (PM2.5), and ozone (O3). Aclima’s platform analyzes and quality assures pollution measurements to develop these maps.
The road ahead
Project Air View’s air quality insights will be integrated into the European Commission-funded European Expanse project, which is exploring how pollution is impacting the health of Europeans and how hyperlocal air quality measurement efforts can inform policy development.
We also plan to equip more Street View cars with air quality mapping capabilities so that we can continue sharing hyperlocal air quality insights. By mapping air quality in more cities, we can equip people with the information they need to create more sustainable cities that protect the health of everyone.