Bringing pixels front and center in VR video
Editor’s Note: This is the first post in a new series where we take a more in-depth and technical look at ways to improve the virtual reality experience. Today, we're deep diving into Equi-Angular Cubemaps, which is a new technique to stream higher quality VR video.
Since ancient times, cartographers have strived to make maps that accurately reflect the world. A central challenge of the art is projecting the Earth, which is curved, onto flat paper and screens. Many methods of projection have been proposed over the centuries, but to date no universally good answer has been found: every choice is always a tradeoff tuned for its intended use. Because new services like Google Maps and applications like VR video seek to provide accurate and meaningful information about our curved, 3D world on a 2D screen, this challenge persists even today.
While traditional cartography techniques must address the basic challenge of how to represent the world in 2D, video streaming also faces a new constraint that early mapmakers didn’t have: making efficient use of bandwidth. Streaming high quality video pushes the limits of network bandwidth, particularly for mobile networks. And when considering VR video, the bandwidth demands are vastly increased since it must represent imagery from a full sphere rather than just a small window onto the world. Stereo video roughly doubles the data yet again. Therefore making the most of available bandwidth is a top concern.
Now, in a joint effort between YouTube and Daydream, we're adding new ways to make 360 and VR videos look even more realistic in a bandwidth-constrained world. This post delves into how these techniques work thanks to Equi-Angular Cubemaps (EACs). To benefit from them, consider putting your content on YouTube. EACs are likely to be useful in many other contexts as well, so we look forward to seeing what can be done with them.Equirectangular Projection
The most familiar representation is one where latitudes and longitudes are used to form a square grid. This is known as the Equirectangular Projection.
The equirectangular projection has the advantages of being both rectangular and straightforward to visualize. It’s also relatively easy to manipulate using existing video editing tools. However, when used for video transmission, it has serious problems. First, the poles get a lot of pixels, and the equator gets relatively few. This is challenging, because spherical videos usually have their important content distributed around the equatorial regions (the middle), which is the viewer’s horizon. It also has high distortion, which makes existing video compression technology work harder.
Taken together, these shortcomings highlight the fundamental challenge of spherical video projection: evenly allocating video pixels over the surface of the display sphere.Traditional Cube Maps
An improvement on equirectangular projections frequently used in the gaming industry is the cube map. This is conceptually simple: deform a sphere into a cube, then unfold the cube’s six faces and lay them flat.
The most straightforward way to do this is with a simple radial projection: you embed the sphere in a cube and project the image on the sphere outwards onto the surface of the cube.
This is an improvement over equirectangular projections, but it still causes substantial variation in pixel density. The problem is that the centers of the cube faces are close to the sphere, while the corners are further away.
In the figure above, the rays have all been equally spaced over the circle, but the points where the rays intersect the square are not equally spaced. As a result, the corners get more video pixels than the centers, because the longer blue line spans more pixels on the square edge than the red line, which again shortchanges the equator. In the full three dimensional case, the effect is even more pronounced.
The Equi-Angular Cubemap (EAC)
You can correct for this variation by changing where you take the video’s pixel samples.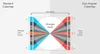
The rays emanating from the center represent a viewer’s line of sight, equally spaced by angular change. On the left is the traditional cubemap, where the mapping from face location to pixel location is linear. On the right is the more efficient EAC mapping.
The traditional cubemap has samples of varying length depending on the sample’s location on the cube face. EAC is specifically constructed to keep these lengths equal, creating uniformly allocated pixels. For all the reasons that cartography is hard, this 2D picture does not extend perfectly into 3D: if you choose to preserve one important feature of the mapping you invariably give up something else. Check out Conformal Mapping and Equal Area Projections for more information on preserving some characteristics at the cost of others. The EAC formula is mathematically precise in 2D, but only an approximation of an equal angle pixel distribution in 3D, albeit a pretty good approximation with manageable distortion.
Uniformity Comparisons
A useful method to visually compare different projection types is to use saturation maps. A saturation map shows a color-coded ratio of video pixel to display pixel density. The color coding goes from red to orange, yellow, green and finally blue. Green indicates an optimal pixel density ratio that’s near 1:1. Red, orange and yellow indicate insufficient density (too few video pixels for the available display pixels), and blue indicates wasted resources (too many video pixels for the available display pixels). You can change the overall colors on a saturation map by increasing the resolution of the video. But for a saturation map with lots of variation, as you bring the least saturated areas to green, you also increase the area of the video where resources are being wasted. Therefore, the ideal projection has a saturation map that is uniform in color - because it can be uniformly green with sufficient resolution.
Saturation is highly dependent on the size of the image as well as the resolution of the output device. Different choices of resolutions will alter the overall greenness or orangeness. The saturation maps below were generated from a specific case study, chosen to maximize the visibility of variation in saturation.
Unsurprisingly, in the Equirectangular projection the poles are blue (wasteful, too many video pixels) and the equator orange (poor quality, too few video pixels).
In comparison, the Standard Cubemap moves the optimal green regions from near the poles towards the equator. The wasteful blue regions at the poles are gone altogether. On the other hand, the cubemap is better at the corners of the cube as compared to the center of its faces. Moreover, the equatorial region has the most variation in saturation, and the centers of the cube faces are actually lower quality than the worst regions of the equirectangular projection.
Finally, the EAC projection’s saturation is significantly more uniform than either of the previous two, while further improving quality around the equator. This uniformity allows maximal use of available bandwidth, thereby permitting a choice of whichever resolution delivers optimal pixel density in a given circumstance.
The Proof is in the Pudding
The end result of all this work is an easily visible improvement in viewer video quality. The image shows screen captures of the left eye for 360 stereo video at 720p displayed in a 1080p Google Cardboard viewer. The bigger image is for context of the scene, while the smaller callouts are zoomed in regions to make the differences more apparent. The callouts compare what this scene looks like with an equirectangular projection as opposed to the new Equi-Angular Cubemap. As you can see, the image is clearer with an EAC projection.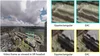
The Devil is in the Details...
That covers how the EAC projection works in principle. But it’s worth addressing the layout of the cube faces in the video’s rectangular bounds and the actual math. The equations mapping a point on a cube face to a video pixel sample are straightforward.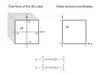
An analogous operation is done for each face.
Now all six sets of [0, 1] texture coordinates need to be packed into a single video texture. If video shape and size are constrained by hardware or streaming limitations, these layouts can be nontrivial, and they may require analysis in their own right. There are many different ways to layout the six faces of the cube into a video rectangle. In addition, there might be discontinuities where faces meet each other, which can cause problems with video encoding and pixel interpolation when rendering. Texture atlases used in games have similar issues, and they are usually addressed by adding padding at the discontinuities. These details offer an opportunity for making choices and tradeoffs for the way the abstract EAC concept is deployed.
For those of you who are familiar with OpenGL, you may have noticed that this can all be done with a cubemap texture and a fragment shader which alters the texture lookups. You’re correct! The actual math is left as an exercise for the reader.
Image quality matters a lot for VR, and it’s important to balance accurate projections with the realities of bandwidth constraints. Having reviewed some of the challenges with equirectangular projections and traditional cubemaps, it’s clear that Equi-Angular Cubemaps offer better results and more efficient use of resources. We believe it’s worth understanding EAC projections, since this is how we’re achieving higher quality streaming at lower bandwidth on YouTube. We’re excited to see how you use them in other contexts as well.