Pivot to the cloud: intelligent features in Google Sheets help businesses uncover insights

When it comes to data in spreadsheets, deciphering meaningful insights can be a challenge whether you’re a spreadsheet guru or data analytics pro. But thanks to advances in the cloud and artificial intelligence, you can instantly uncover insights and empower everyone in your organization—not just those with technical or analytics backgrounds—to make more informed decisions.
We launched "Explore" in Sheets to help you decipher your data easily using the power of machine intelligence, and since then we’ve added even more ways for you to intelligently visualize and share your company data. Today, we’re announcing additional features to Google Sheets to help businesses make better use of their data, from pivot tables and formula suggestions powered by machine intelligence, to even more flexible ways to help you analyze your data.
Easier pivot tables, faster insights
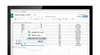
Many teams rely on pivot tables to summarize massive data sets and find useful patterns, but creating them manually can be tricky. Now, if you have data organized in a spreadsheet, Sheets can intelligently suggest a pivot table for you.
In the Explore panel, you can also ask questions of your data using everyday language (via natural language processing) and have the answer returned as a pivot table. For example, type “what is the sum of revenue by salesperson?” or “how much revenue does each product category generate?” and Sheets can help you find the right pivot table analysis.
In addition, if you want to create a pivot table from scratch, Sheets can suggest a number of relevant tables in the pivot table editor to help you summarize your data faster.
Suggested formulas, quicker answers
We often use basic spreadsheet formulas like =SUM or =AVERAGE for data analysis, but it takes time to make sure all inputs are written correctly. Soon, you may notice suggestions pop up when you type “=” in a cell. Using machine intelligence, Sheets provides full formula suggestions to you based on contextual clues from your spreadsheet data. We designed this to help teams save time and get answers more intuitively.
Even more Sheets features
We’re also adding more features to make Sheets even better for data analysis:
- Check out a refreshed UI for pivot tables in Sheets, and new, customizable headings for rows and columns.
- View your data differently with new pivot table features. When you create a pivot table, you can “show values as a % of totals” to see summarized values as a fraction of grand totals. Once you have a table, you can right-click on a cell to “view details” or even combine pivot table groups to aggregate data the way you need it. We’re also adding new format options, like repeated row labels, to give you more fine-tuned control of how to present your summarized data.
- Create and edit waterfall charts. Waterfall charts are good for visualizing sequential changes in data, like if you want to see the incremental breakdown of last year’s revenue month-by-month. Select Insert > Chart > Chart type picker and then choose “waterfall.”
- Quickly import or paste fixed-width formatted data files. Sheets will automatically split up the data into columns for you without needing a delimiter, like commas, between data.
These new Sheets features will roll out in the coming weeks—see specific details here. To learn more about how G Suite can help your business uncover valuable insights and speed up efficiencies, visit the G Suite website. Or check out these tips to help you get started with Sheets.