Visualize data instantly with machine learning in Google Sheets

Sorting through rows and rows of data in a spreadsheet can be overwhelming. That’s why today, we’re rolling out new features in Sheets that make it even easier for you to visualize and share your data, and find insights your teams can act on.
Ask and you shall receive → Sheets can build charts for you
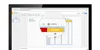
Explore in Sheets, powered by machine learning, helps teams gain insights from data, instantly. Simply ask questions—in words, not formulas—to quickly analyze your data. For example, you can ask “what is the distribution of products sold?” or “what are average sales on Sundays?” and Explore will help you find the answers.
Now, we’re using the same powerful technology in Explore to make visualizing data even more effortless. If you don’t see the chart you need, just ask. Instead of manually building charts, ask Explore to do it by typing in “histogram of 2017 customer ratings” or “bar chart for ice cream sales.” Less time spent building charts means more time acting on new insights.
Instantly sync your data from Sheets → Docs or Slides
Whether you’re preparing a client presentation or sharing sales forecasts, keeping up-to-date data is critical to success, but it can also be time-consuming if you need to update charts or tables in multiple sources. This is why we made it easier to programmatically update charts in Docs and Slides last year.
Now, we’re making it simple to keep tables updated, too. Just copy and paste data from Sheets to Docs or Slides and tap the “update” button to sync your data.
Even more Sheets updates
We’re constantly looking for ways to improve our customers’ experience in Sheets. Based on your feedback, we’re rolling out more updates today to help teams get work done faster:
- Keyboard shortcuts: Change default shortcuts in your browser to the same spreadsheet shortcuts you’re already used to. For example, delete a row quickly by using “Ctrl+-.”
- Upgraded printing experience: Preview Sheet data in today’s new print interface. Adjust margins, select scale and alignment options or repeat frozen rows and columns before you print your work.
- Powerful new chart editing experience: Create and edit charts in a new, improved sidebar. Choose from custom colors in charts or add additional trendlines to model data. You can also create more chart types, like 3D charts. This is now also available for iPhones and iPads.
- More spreadsheet functions: We added new functions to help you find insights, bringing the total function count in Sheets to more than 400. Try “SORTN,” a function unique to Sheets, which can show you the top three orders or best-performing months in a sales record spreadsheet. Sheets also support statistical functions like “GAMMADIST,” “F.TEST” and “CHISQ.INV.RT.”
These new features in Sheets are rolling out starting today. Learn how Sheets can help you find valuable insights.